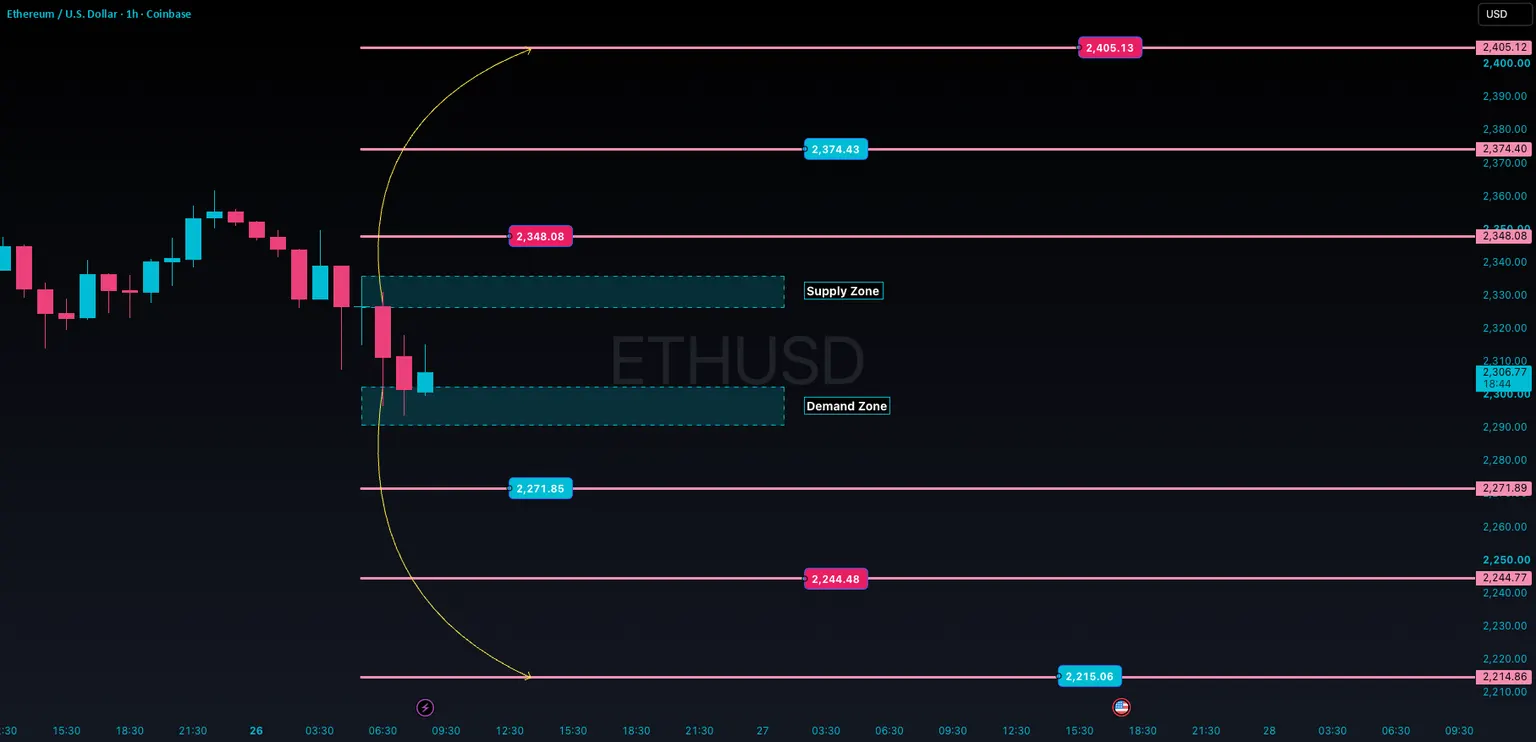
Ethereum is facing selling pressure on the 1-hour chart and is trading around $2,305, according to the attached snapshot. After failing to sustain its earlier recovery, ETH moved toward the $2,290–$2,302 demand area, which is identified as the immediate demand zone. The price is trading below the marked supply zone following a sharp decline, and the immediate battle described is between buyers defending demand and sellers attempting to maintain bearish momentum.
The levels identified include the $2,271.89 first major downside reference, $2,244.77 next support and $2,214.86 lower support, alongside the $2,326–$2,336 immediate supply zone, $2,348.08 first major upside reference, $2,374.40 next resistance and $2,405.12 major upper resistance. The bearish scenario depends on Ethereum failing to hold the $2,290–$2,302 zone, with the analysis citing a decisive 1-hour candle close below demand and a failed retest of the broken zone as signals of possible downside continuation. The bullish case requires ETH to hold the demand zone, reclaim the $2,326–$2,336 supply zone and show a successful retest or higher low to support recovery.
Between $2,290 and $2,336, price may remain choppy. The analysis states that below $2,290 traders should watch for a confirmed breakdown and potential continuation toward lower supports, while above $2,336 a sustained reclaim could open a recovery toward higher resistance. The scenarios are described as conditional, not guaranteed targets or predictions. The analysis is educational only, based on the supplied ETHUSD 1-hour chart dated October 26, 2026, and states that levels must be rechecked against live market data.